Plot and analyse results
In a VM, AEMO Australian Energy Market Operator provides Plotting Buddy, an application that can plot multiple channels from different output file formats and provide data analysis.
Note: The *.psout file format in PSCAD v5 is not supported. Make sure PSCAD is configured to generate legacy .out files. See Enable output files in PSCAD.
Plotting Buddy interface
To open Plotting Buddy, double-click on the Plotting_Buddy desktop icon in the VM.
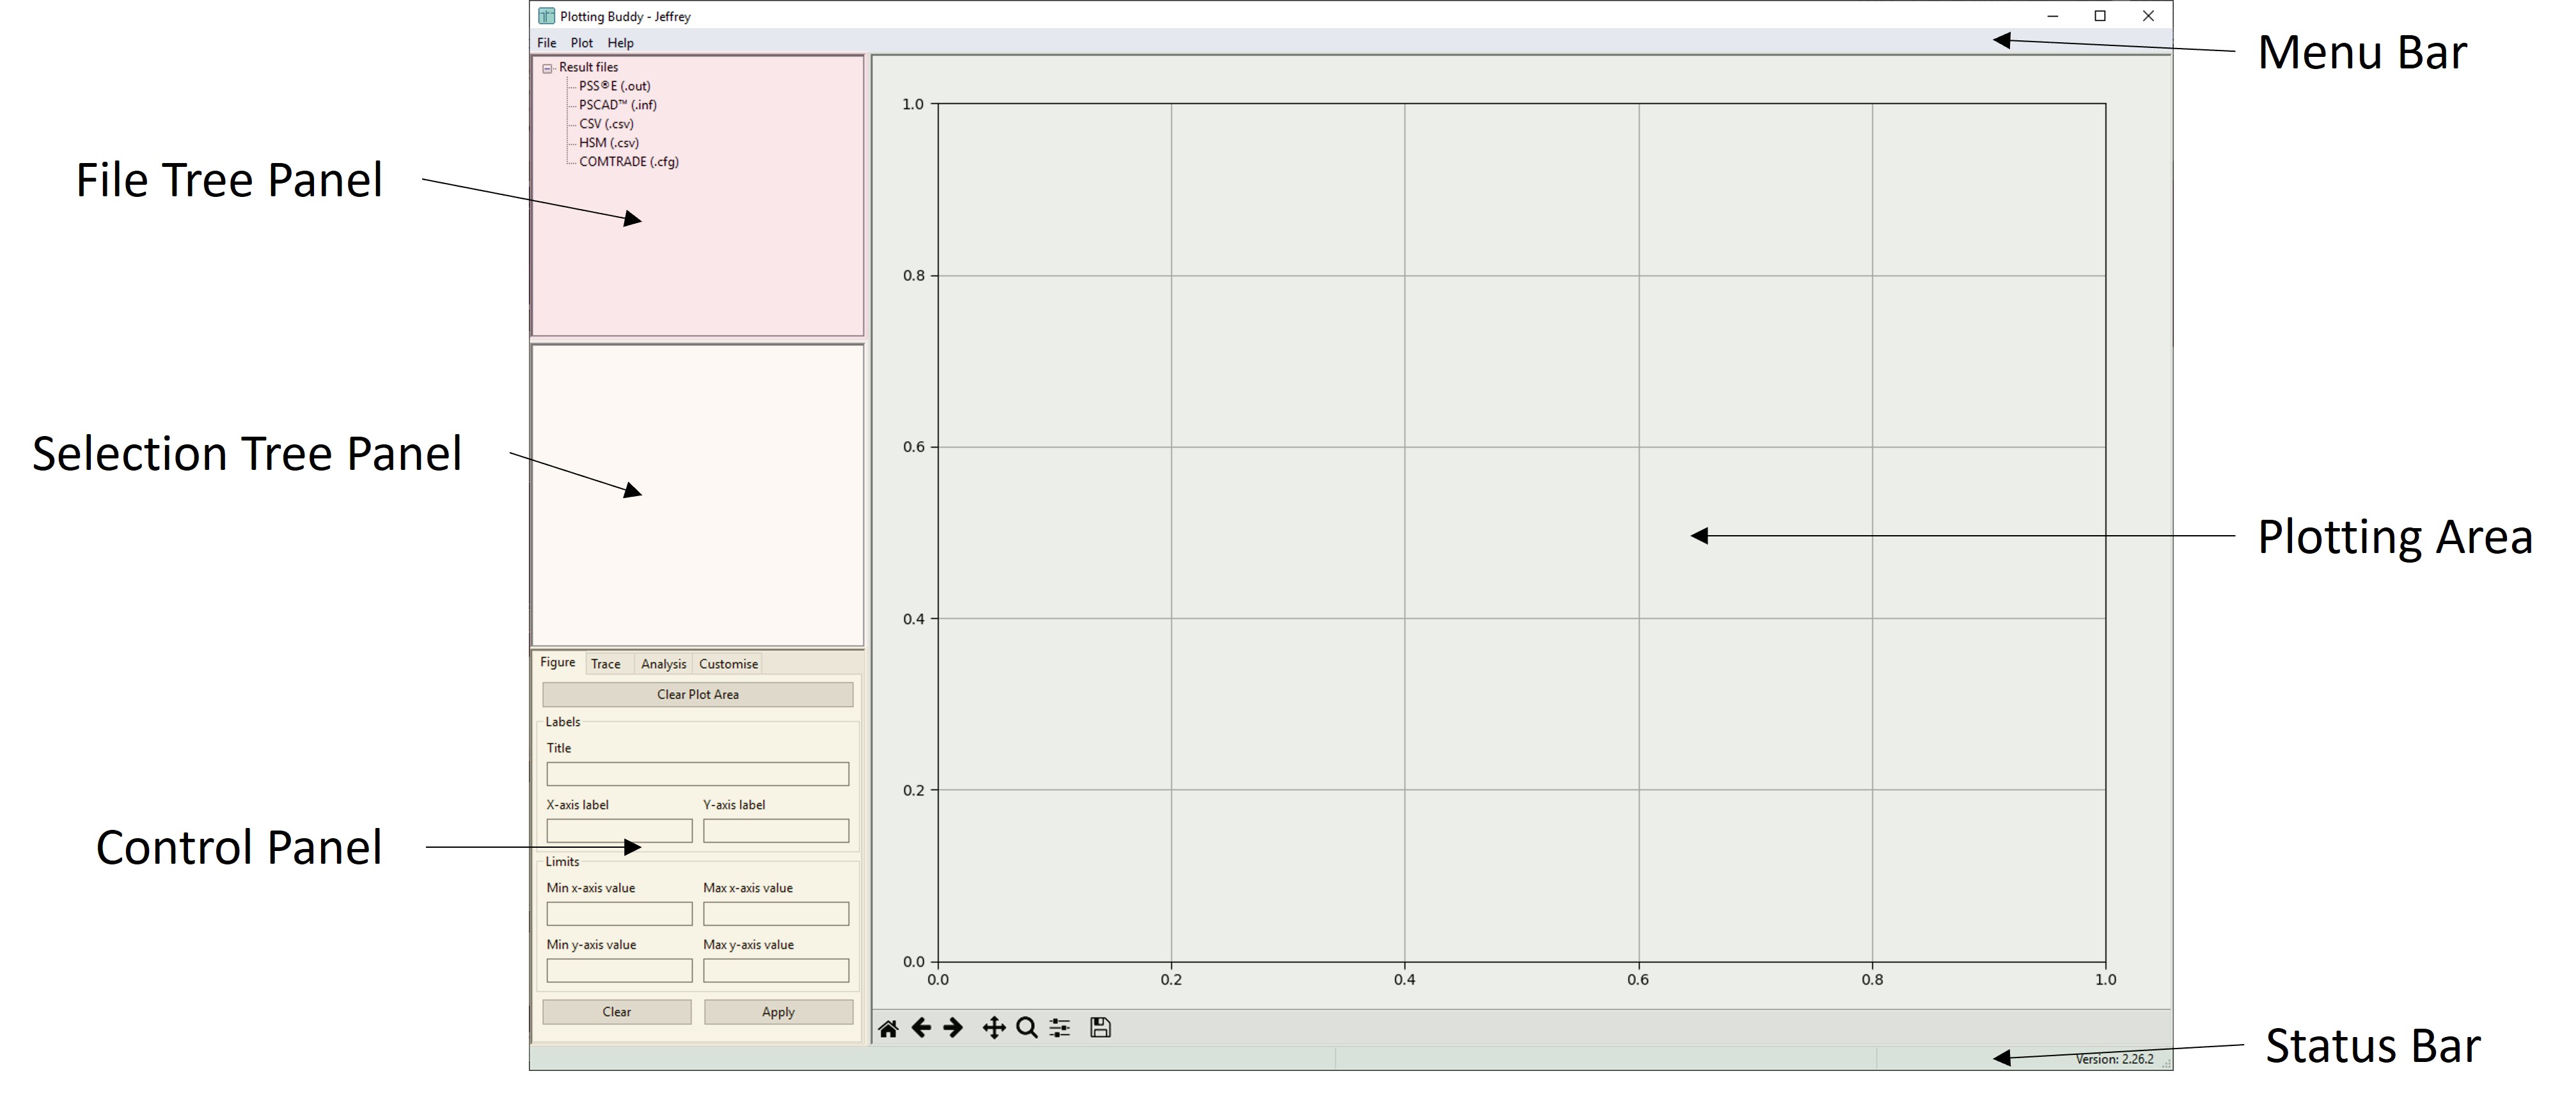
The Plotting Buddy contains the following in the interface:
-
Menu Bar – Menu options to import output files, configure the tool and the plotting area to set up configure the tool and export plots
-
File Tree Panel – Lists the selected output files
-
Selection Tree Panel – Lists the channels in an output file that can be plotted
-
Control Panel – Allows configuration of the graphs displayed in the plotting area
-
Status Bar – Displays status message an cursor coordinates in the plotting area
-
Plotting Area – displays results
Plotting results
Plotting Buddy allows you to plot signals in the plotting area or in several plotting area tabs.
To plot your results:
-
Click File > Open File.
-
Navigate to your Client model folder with the inf files. For example: E:\PSCAD\Client_Model\Windy_Windfarm.if18_x86\Windy_05.inf.
-
Click Ok. The output files associated with the inf file is listed in the File Tree Panel. Alternatively, you can drag and drop PSCAD .inf files to the File Tree Panel.
-
In File Tree Panel, select the file to plot.
-
In the Selection Tree Panel, click on the channels in the file to plot and drag them into the plotting area.
Modifying the figure
In the Control Panel, the figure tab provides configuration settings to the selected figure in the plotting area.
|
Field / Button |
Description |
|---|---|
|
Clear Figure |
Button to clear signals in the figure. |
|
Title |
Name of the figure. |
|
X-axis label |
Name of the x-axis. |
|
Y-axis label |
Name of the y-axis. |
|
Limits |
Section to define the minimum and maximum x-axis and y-axis values. This is useful to view several signals in the same Figure. |
|
Clear |
Clear configuration settings. |
|
Apply |
Button to apply changes to the settings. |
Analysing results
In the Control Panel, the Analysis tab can define an analysis window for a signal to display the rise time, recovery time, setting time, and 10% band.
|
Field / Button |
Description |
|---|---|
|
Select Plot Trace |
Option to select the signal in the Figure for analysis. The signal needs to be plotted and visible in the plotting area. |
|
Start Time |
The signal’s start time for analysis. You can place your mouse cursor on the figure to determine the time. |
|
End Time |
The signal’s end time for analysis. You can place your mouse cursor on the figure to determine the time. |
|
Rise Time |
Rise time as defined in the NER. It is from 10-90%. |
|
Recovery Time |
Start Time is the time at which the user would pick the pre-disturbance value prior to a disturbance or fault. End Time is the time when the disturbance or fault is cleared. Start Time is averaged the same way as rise/settling time |
|
Setting Time |
Setting time as defined in the NER. Time to settle within 10% of the settled value. |
|
10% bands |
Applies +/-10% bands to the signal based on the maximum change during the analysis window. |
|
Add |
Button to show selected measurements in the plotting area. |
The inputs can differ depending on the analysis being performed.
For the rise time and settling time, the start time is the time at the start of the window to commence the rise or settling time calculation. The end time is the time at the end of the window for rise or settling time calculation.
The signal values to be analysed can also be averaged. The syntax for average is <T1>:<T2> where T1 and T2 are times and T1 is less than T2. For example, to average between 10 and 20 seconds, the input would be 10:20. The average can be in both Start Time and End Time.
If averaging the values:
-
for Start Time, the commencement time for rise/settling time calculation is T2.
-
for End Time, the end time for rise/settling time calculation is T1.